Data Visualization
Visuals that clarify results and support decisions.
Overview: We craft static and interactive visuals that meet scientific standards and drive action.
We can help you with:
Static & interactive data visualizations — Purposeful charts and dashboards for insight and storytelling.

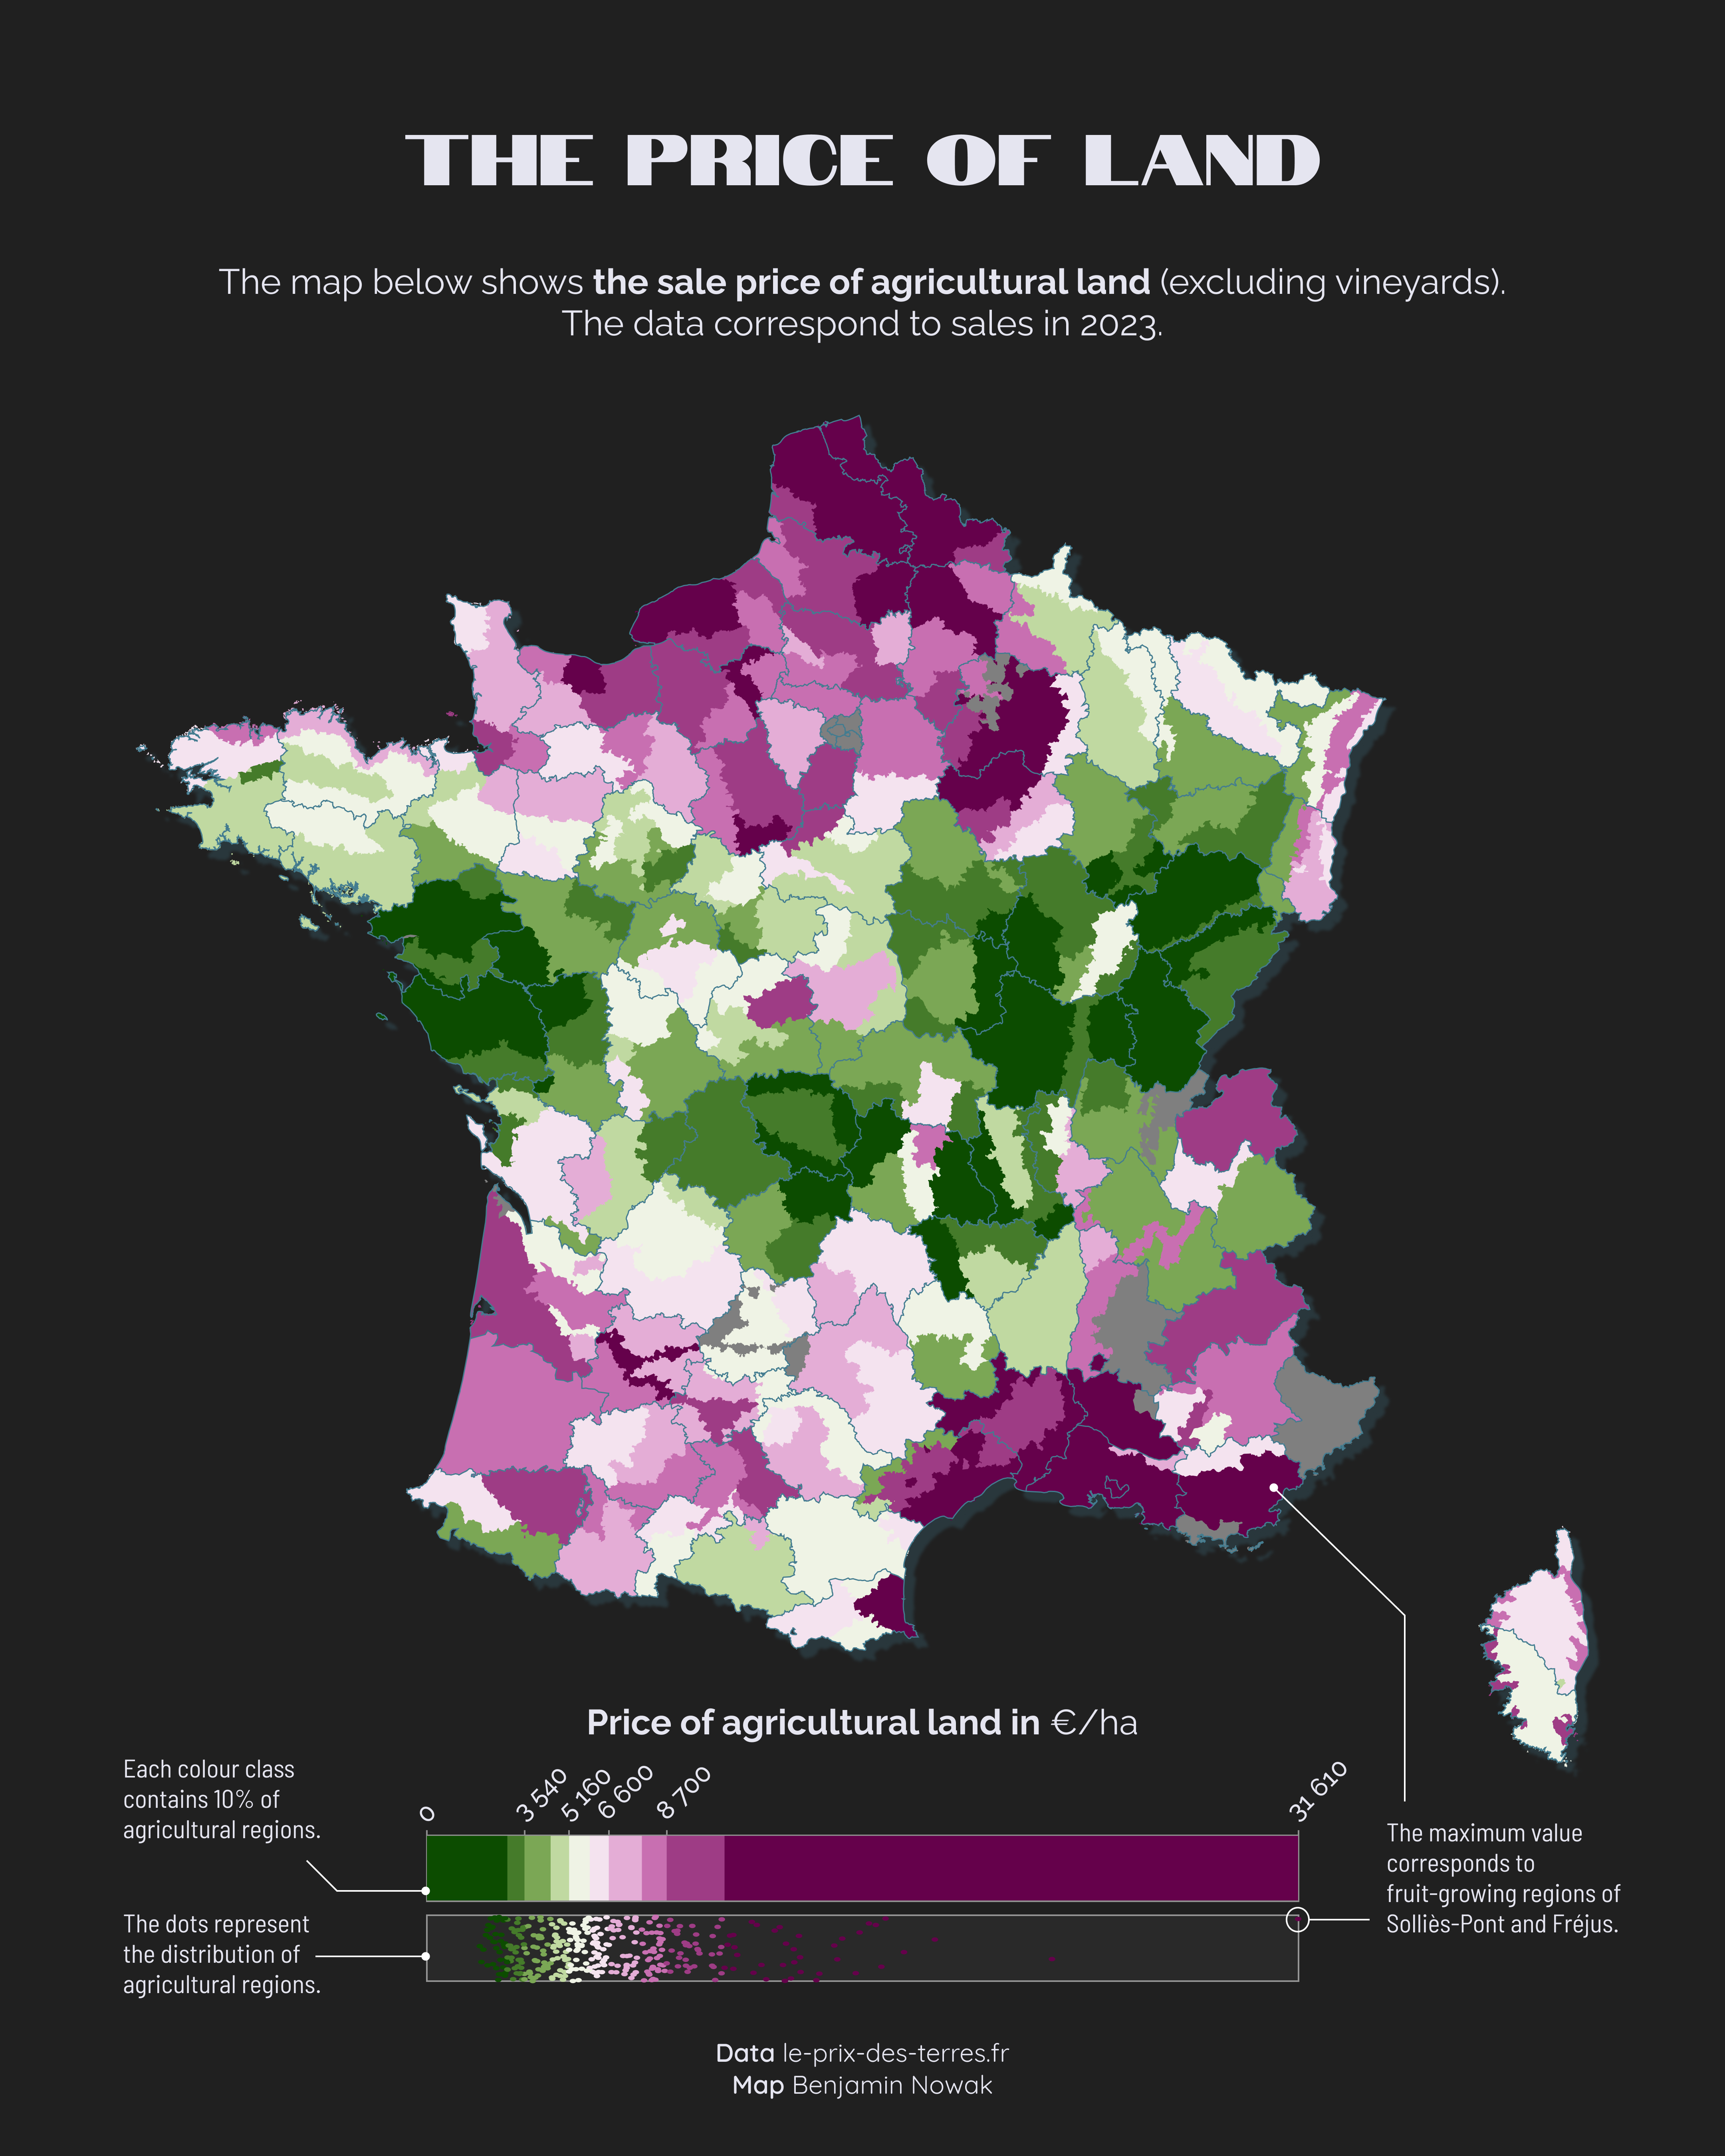
Geospatial & cartographic visualization — Map design, tiled maps, choropleths and spatial analysis to reveal geographic patterns and spatial relationships.
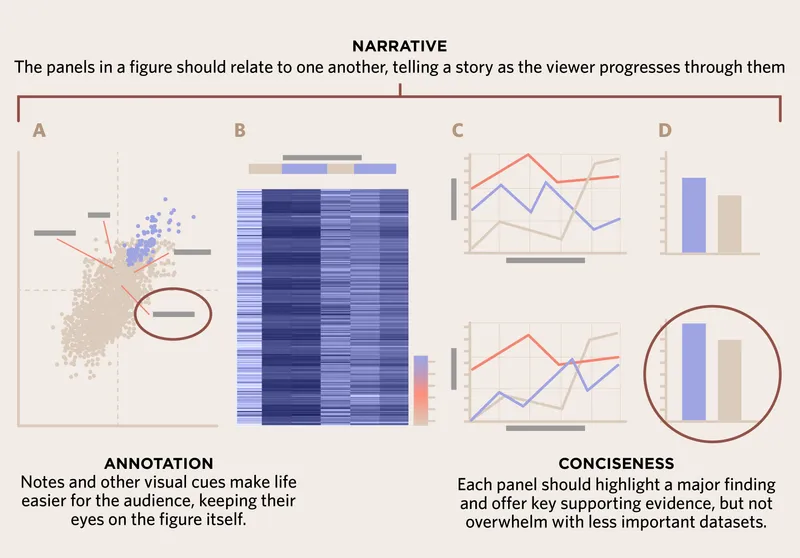
Graphical review of scientific figures — Improve clarity, reproducibility and journal readiness.
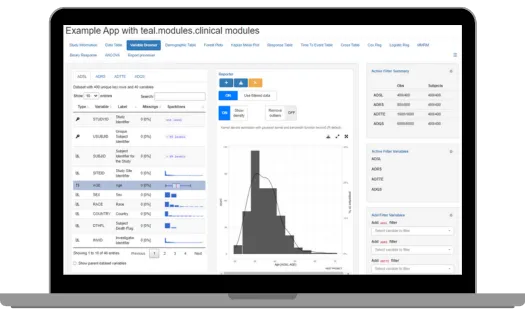
Shiny dashboards & exploration interfaces — Interactive tools for probing data and exporting results.
Client‑facing clinical reports — Concise, action‑oriented deliverables.
Benefits: Clearer insight, better stakeholder buy‑in and publishable visual outputs.